.avif)
TL;DR
- A/B testing your connection request means sending 2 message versions to 2 groups and comparing acceptance rates
- You need at least 100 people per version, so 200 total, to trust the result
- The 2026 average LinkedIn acceptance rate is around 28 to 30%. A good rate is 30 to 45%. Below 20% is a warning sign
- LinkedIn does not have a built-in way to A/B test connection requests. You need a third party tool
- SalesRobot splits your prospects between two message versions automatically and tracks each one separately
- SalesRobot starts at $59/month with a 14-day free trial, no card required

Here's what usually happens.
Someone sends 10 connection requests with one message. Then they send 10 more with a different message.
Three more people accept the 1st one, so they call it the winner.
But this isn’t a real test, because the volume is not big enough to know what is actually happening.
A real A/B test needs enough people in each group and a fair way to compare them.
In this blog I'll tell you how to do that properly, and how to set it up inside SalesRobot easily!.
🎯 Why you should look at acceptance rates first
🎯 What you should actually be testing
🎯 How many people you need for a result you can trust
🎯 How to set up an A/B test using SalesRobot!
But first, here’s why you should look at your acceptance rates first
If someone doesn't accept your connection request, nothing else matters.
They never see your follow-up message, they won’t reply, and won’t book a call.
That's why acceptance rate is the first number you should look at
So what counts as good?
In 2026, the average LinkedIn connection request gets accepted around 28 to 30% of the time.
A good rate is between 30 and 45%.
Anything under 20% usually means your targeting or your message needs work.
LinkedIn may also start limiting how many requests you can send per week.
Now if you’re including a note with your message, it’s kind of an unsaid rule that you need to personalize it.
If you’re sending “hi, would love to connect!”

Generic mass requests often go below 10-15%, while requests personalized to the prospect's actual profile can go above 45%.
Which is what we want, right?
So here’s what you can actually test
Only change one thing at a time.
If you change the opening line and the length and the CTA all at once, you won't know which change caused the result.
Here's what's you should do:
- With a note vs. no note. Some people skip the note entirely and rely on a strong profile instead
- Short vs. longer, both under the cap. A note maxes out at 300 characters. Test something around 100 to 150 characters against one closer to the full 300
- Question vs. statement. Ending with a question tends to invite a response so it may help with acceptance
Here’s how to run a test:
Step 1: Write a clear hypothesis
To build a solid foundation for your A/B test, you need to have a clear hypothesis.
This gives you something to check your result against, instead of calling a winner based on a feeling.
It should include the variable you’re testing, your audience, the metric you’re tracking, and the expected outcome.
Step 2: Use enough people
You need at least 100 people per version. That means 200 people total for a basic two-way test.
Fewer than that, and a 5 point difference in acceptance rate could just be random chance. It might not happen again next time.
Step 3: Send both versions at the same time
If you send Version A on Monday and Version B on Friday, you're testing the day, not the message.
Split your list randomly, then launch both versions in the same window. That’s when you’ll know the true image.
Step 4: Let it run for at least a week
2 or 3 days isn't enough. People accept connection requests differently depending on the day of the week.
Run the test for at least a week. Two weeks is safer if your volume allows it.
Step 5: Check acceptance rate and reply rate separately
A version can win on acceptance and still lose on replies.
If that happens, your profile and opener are doing their job, but the follow-up message needs work.
Now if you’re thinking about doing ALL of this by hand…
Hard, really hard.
You'd have to split your list into 2 equal random groups yourself.
Then write messages for both groups, launch them at the exact same time, and track two sets of results without mixing them up.
But you know me, I never show up without a fix.
That's where SalesRobot comes in.
How to set up an A/B test in SalesRobot
So how do you actually pull this off without losing your mind?
Glad you asked.
Using SalesRobot!
SalesRobot writes personalized openers for each prospect using AI Variables.
It also lets you A/B test your connection requests, split your list into two equal halves and send both versions out automatically.
Then you just sit back and see which version does better.
Here's how to set it up 👇
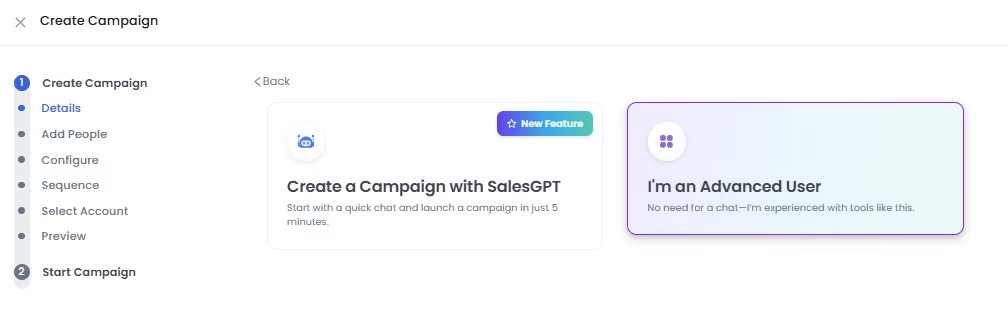
- Choose your campaign type (Create campaign with LinkedIn or Create campaign with Email and LinkedIn).
- Select I'm an Advanced User.
- Select how you want to add your leads (LinkedIn Search URL, Sales Navigator URL, CSV, Lead List, etc.),
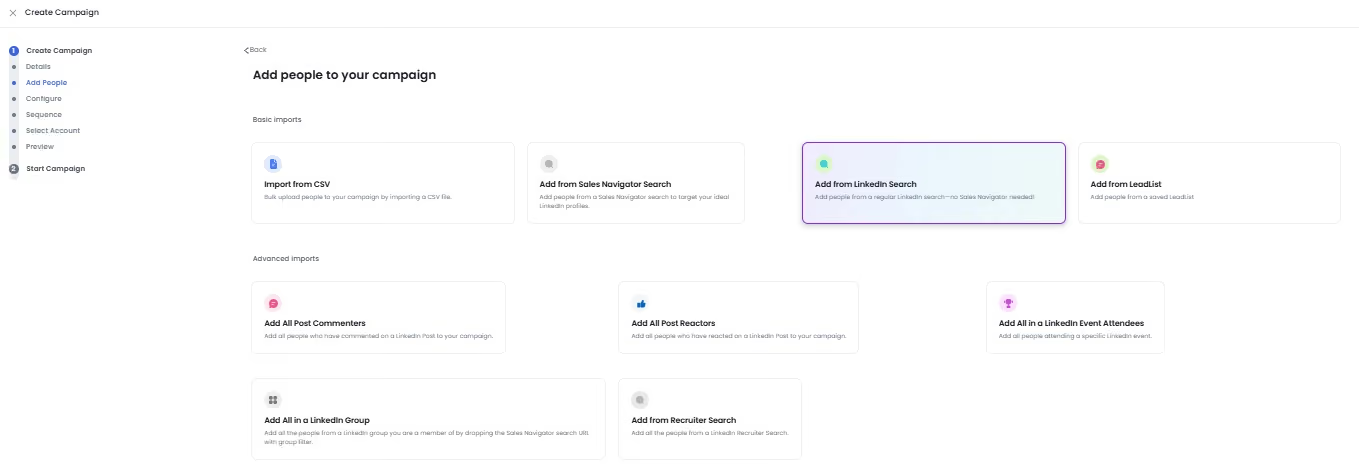
- Then paste your LinkedIn search URL, on this page here:

- Click on Save and proceed to Sequence.
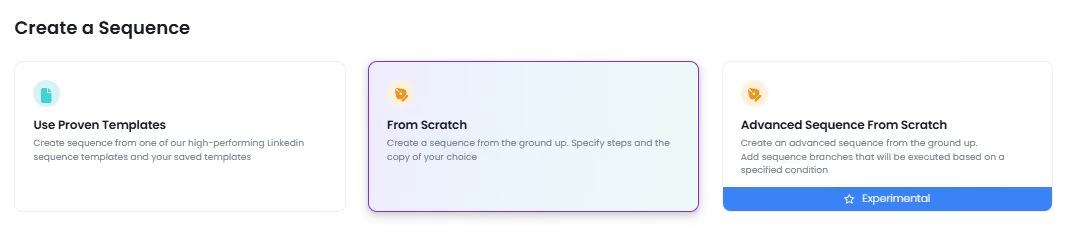
- On the next page, you’ll see options to create a sequence, choose From Scratch option to build your sequence.
- In Step 1 (Send Connection Request), click on the "+" icon next to the step.
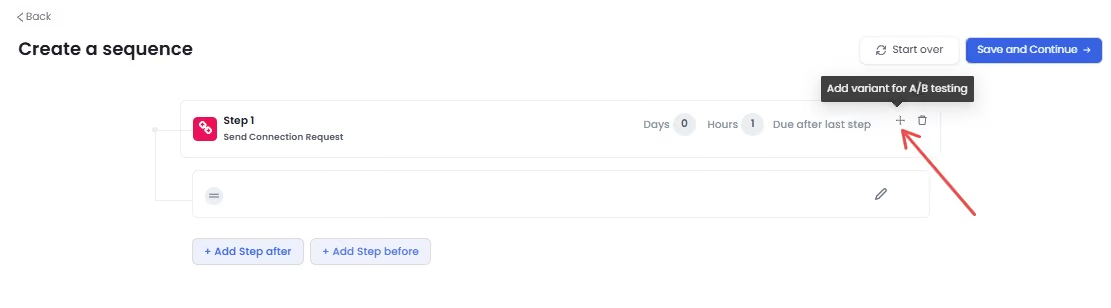
- This will create a second version of the same step.
- Edit Variant A with your first message, and then edit Variant B with a different version of the message (change the hook, tone, CTA, or structure).
You can similarly add A/B variants to follow-up messages as well. Simply click the "+" icon next to any follow-up step and create an additional variant for testing.

Now you just have to configure delays and additional follow-up steps as needed. Once you've created your sequence, click Save and Continue.
On the next page, select any prospect and click View Complete Sequence to preview the entire sequence exactly as that prospect will receive it.
Review your messages one final time, make any necessary edits, and then launch your campaign!
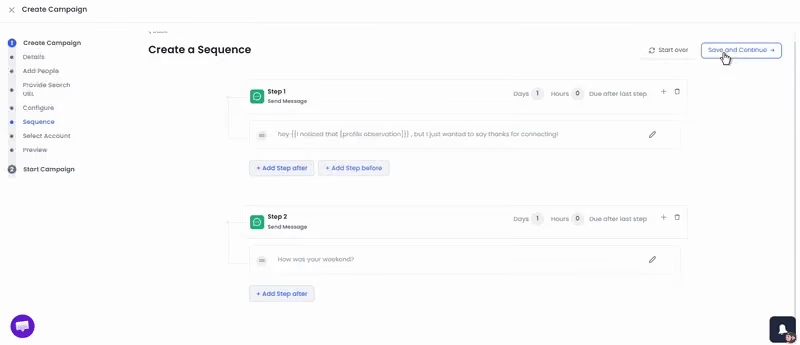
Once it's live, SalesRobot automatically splits your prospects between Variant A and Variant B and tracks performance for each one separately.
You can compare acceptance and reply rates for both versions right inside your campaign analytics, no spreadsheet needed.
Common mistakes that ruin a test
- Calling it too early. Three days and 20 sends is not a result
- Testing two things at once. You won't know which change actually worked
- Small sample size. Under 100 per version, and the result could easily be random chance
- Only looking at acceptance rate. A high acceptance rate with zero replies is still a problem
- Sending each version on different days. This tests timing, not your message
Frequently asked questions
What's a good LinkedIn connection request acceptance rate?
In 2026, the average sits around 28 to 30%. A good rate is 30 to 45%. Above 45% is strong, and below 20% usually points to a targeting or messaging problem.
How many connection requests do I need to run an A/B test?
At least 100 per version, so 200 total for a two-way test. Smaller samples make it hard to tell a real difference from random chance.
How long should I run an A/B test on LinkedIn?
At least a full week, and two weeks is safer if your volume allows it. Shorter tests can be skewed by which days of the week you happened to send on.
Wrapping up
A/B testing your connection request isn't complicated once you have the setup for it.
Pick one variable, use enough people, run it long enough, and check both acceptance and replies before you call a winner.
If you want to try this without building a tracking spreadsheet, SalesRobot splits and tracks your variants automatically.
Start your 14-day free trial, no card needed.

Wow your leads by cloning yourself and sending personalized videos and voice notes to each lead on LinkedIn.
If you don't reply to leads within 5 mins, your chances of converting them fall by 50%. Our AI replies on your behalf instantly! (and yes, you can train it)

Don't shoot in the dark. Get detailed analytics on what's working
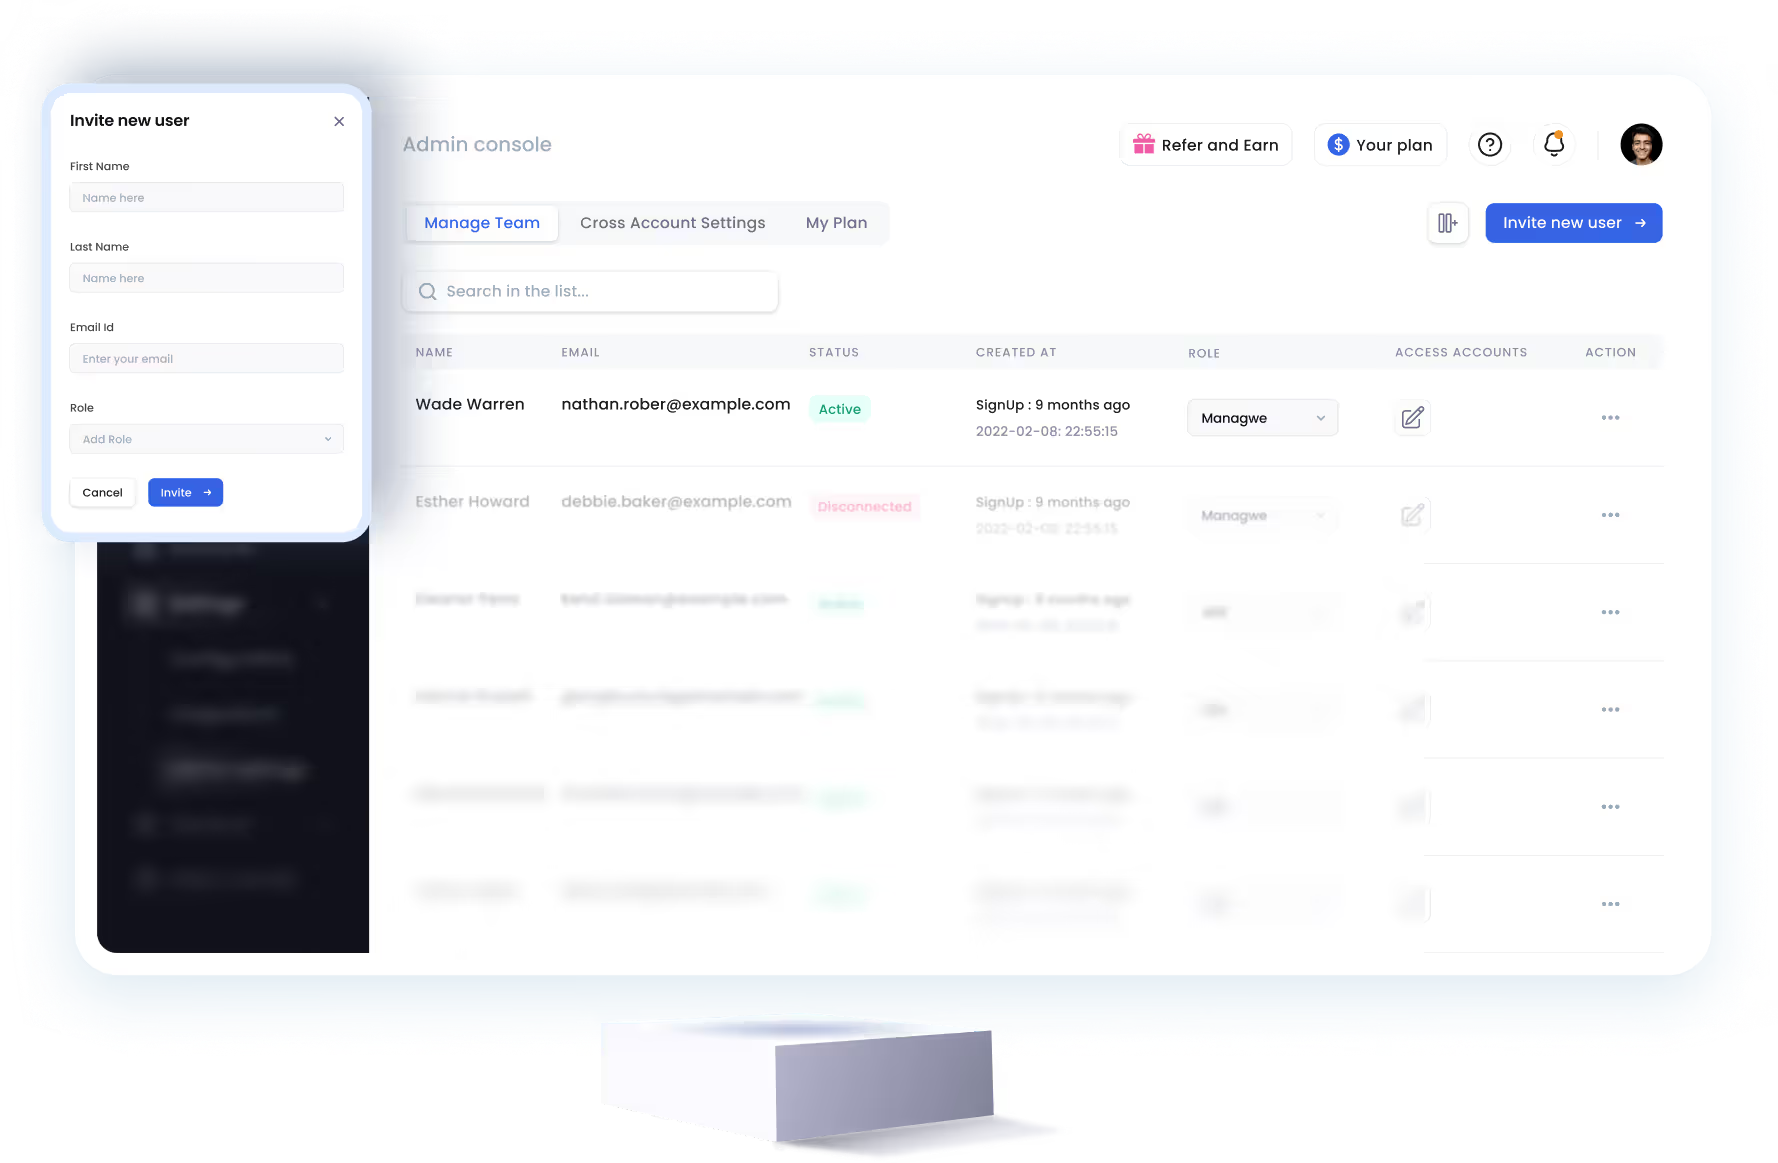
SalesRobot allows you to invite other team members, so that they can add their LinkedIn Account, run outreach campaigns and get amazing results just like you.
.avif)


Trusted by 4100+ innovative B2B sales teams and lead gen agencies

.avif)

.avif)




.avif)


Heading 1
Heading 2
Heading 3
Heading 4
Heading 5
Heading 6
Lorem ipsum dolor sit amet, consectetur adipiscing elit, sed do eiusmod tempor incididunt ut labore et dolore magna aliqua. Ut enim ad minim veniam, quis nostrud exercitation ullamco laboris nisi ut aliquip ex ea commodo consequat. Duis aute irure dolor in reprehenderit in voluptate velit esse cillum dolore eu fugiat nulla pariatur.
Block quote
Ordered list
- Item 1
- Item 2
- Item 3
Unordered list
- Item A
- Item B
- Item C
Bold text
Emphasis

Superscript
Subscript