TL;DR
- The 2026 platform-wide LinkedIn connection acceptance rate is 28.5%, measured across 13.2 million requests (Expandi).
- A good rate sits between 30% and 45%, and anything below 20% triggers account throttling.
- Acceptance varies wildly by industry: Broadcast Media (~40.1%) and Staffing & Recruiting (~36.5%) lead, Computer Software (~27.5%) is average, Finance & Banking (~25%) lags, and C-suite prospects (18–25%) are the hardest to reach in any vertical.
- Personalized requests hit ~45% acceptance vs ~15% for generic ones: a 3x difference.
- 2026 weekly sending limits are dynamic: 80–100 requests/week standard, up to 200/week for high-trust accounts, as low as 50/week if you're flagged.
- The decision line: if your acceptance rate is above 30%, scale volume carefully; if it's below 20%, fix targeting and personalization before you send another request.
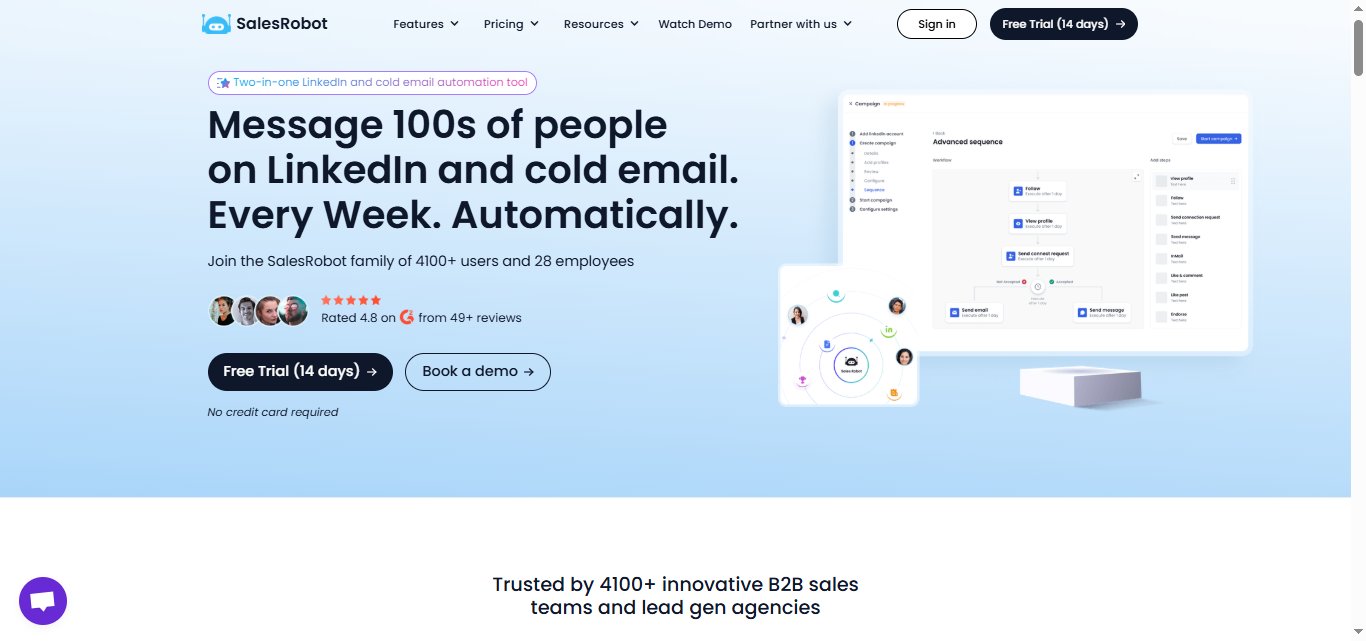
- 👉 Skip the guesswork: SalesRobot runs safe, AI-personalized LinkedIn campaigns that average a 51% acceptance rate — try free for 14 days.
Is Your LinkedIn Acceptance Rate Actually Good — Or Just Average?
An SDR I know hit 26% acceptance on her campaign and threw a tiny party. "Above the average," she said.
Then she found out her main competitor, a recruiting agency, was clearing 36% on the same prospect pool. And her finance targets? Quietly sandbagging her at 24%.

She'd been benchmarking against the platform average the whole time. Which is a bit like judging your marathon pace against "the average human walking speed."
Here's the problem with almost every acceptance-rate guide: they hand you one number. The overall average.
As if a software founder messaging finance executives plays the same game as a recruiter messaging HR managers.
They don't. Not even close.
So this post does three things:
- It gives you the 2026 acceptance rates broken down by industry,
- It shows the four levers that actually move your number inside any vertical,
- and it tells you, bluntly, whether you're winning or losing for your segment.
What the 2026 Data Actually Shows: The Platform-Wide Baseline
A LinkedIn connection acceptance rate is the percentage of sent connection requests that get accepted.
The 2026 platform-wide average is 28.5%, measured across 13,218,869 requests sent through 13,302 active accounts between May 2025 and April 2026.
That's your starting reference point.
But "acceptance" is only one of three numbers worth tracking.

Think of LinkedIn outreach as a three-stage funnel, each with its own benchmark:
- Connection acceptance rate: 28.5% platform average
- Connection-note reply rate: 3.0% platform average
- Message reply rate (after connecting): 10.4% platform average
Other large datasets land in the same neighborhood: emailsearch.io reports ~30% across 500K requests, SalesBread reports 37% across 16,492 requests, and Expandi's figure was 29.61%. So 28.5–37% is the credible 2026 range for a cross-industry average.
Now the uncomfortable trend.
The connection-note reply rate dropped from 3.5% in May 2025 to 2.2% in April 2026 — a 37% relative decline in a single year.
Why? The inbox is getting loud.
Translation: getting accepted is one thing. Getting a reply is getting harder by the quarter.
2026 LinkedIn Acceptance Rates by Industry: The Full Breakdown
Here's the part most guides skip: the actual industry table.
The numbers below reconcile two datasets: Expandi's data (segmented by the sender's industry) and Leadriver's data (segmented by the recipient's role).
A note on the sender-vs-recipient distinction, because it matters more than it looks.
Expandi's numbers tell you how your industry performs when sending.
Staffing & Recruiting accounts hit roughly 2x the platform average on every metric: 36.5% acceptance, 6.6% note reply, 18.9% message reply, partly because their outreach is expected and welcomed.
Leadriver's numbers tell you how the people you message behave.
Recruiters and HR contacts accept at 40%+ no matter who's reaching out.
Finance and banking sit near 25%, thanks to compliance caution plus heavy inbound volume.
And senior C-level executives accept at just 18–25% across every single industry.
Here's the practical upshot: the same human can land in two cells at once.
A software SDR messaging finance C-suite is swimming in the red zone on both axes: expect 18–25%, and don't panic when you hit it.
A recruiter messaging HR managers is stacking green on green: if they're under 35%, something's broken.
Benchmark against your row. Not the 28.5% headline.
The Four Factors That Move Your Number (Within Any Industry)
Your industry sets the ceiling and floor.
These four levers, let’s call it The Acceptance Rate Stack, decide where you land inside that range.
1. Targeting precision. A narrower ICP beats a broad list every time.
Finance C-suite may floor at 18–25%, but tight job-title and company-size filters can push that toward 30%+.
In practice, that means a list of 200 perfectly-matched prospects will outperform 2,000 loosely-matched ones.
2. Profile trust signals. Your photo, headline, mutual connections, and Social Selling Index all factor in. Accounts with an SSI score of 65+ earn higher sending capacity and more trust, which feeds directly into acceptance.
3. Personalization. This is the biggest lever. Personalized requests achieve ~45% acceptance versus ~15% for generic outreach.
But here's the nuance everyone gets wrong: adding a note barely changes acceptance: 26.42% with a note vs 26.37% without. The DM matters for replies after the request has been accepted.
4. Sending behavior. Burst patterns, such as firing off 40 requests in 10 minutes, and weekly volume exceeding your account's capacity, are top restriction triggers.
LinkedIn watches how you send as closely as what you send.
Tools like SalesRobot's AI Variables exist precisely for lever #3: pulling profile details automatically so personalization scales, while Safe Mode handles lever #4. More on that shortly.
LinkedIn's 2026 Sending Limits: The Rules That Gate Everything
The rate you achieve is only half the equation: the volume you're allowed to send is the other half.
As of 2026, LinkedIn's weekly connection request limit is dynamic, not a fixed cap:
- 80–100 requests/week — standard accounts
- Up to 200 requests/week — high-trust accounts (SSI 65+, acceptance rate above 40%)
- As low as 50 requests/week — restricted or flagged accounts
So your limit rises and falls with your behavior. Perform well, earn more capacity. Slip, and LinkedIn quietly tightens the tap.
What drops your capacity?
Three things: an acceptance rate sustained below 20%, weekly volume that exceeds your account's capacity, and generic non-personalized messaging patterns.
This is exactly why the 20% danger line matters so much, because it's not just an embarrassing number; it's the trigger that shrinks your future reach.
One more data point that saves you a month of guessing: 63% of acceptances happen within 24 hours, and 88% within 7 days.
You'll know inside a week whether a campaign is working. Don't wait 30 days to call it.
How SalesRobot Helps You Hit Your Industry's Benchmark (Without Getting Throttled)
Now that you know your industry's target number and the four levers that move it, here's where tooling matters, specifically, the gap between tools that send volume and tools that send volume safely.
That's where SalesRobot fits, and it maps cleanly onto the levers above.
Safe sending that respects the dynamic limit. SalesRobot uses mobile API technology that mimics human behavior, randomized delays, human-like daily limits (up to 200 connection requests/week), and residential IP rotation.
Customers report zero account bans when following Safe Mode guidelines. Because it's cloud-based, it runs 24/7 without keeping your browser open.
This directly addresses lever #4 and the burst-pattern triggers that throttle accounts.

AI Variables for the personalization lever. SalesRobot's AI Variables feature enriches each prospect with data from their LinkedIn profile, such as recent job changes, company news, shared connections, and even volunteer work, and uses it to automatically personalize requests.
That's the 45%-vs-15% lever, at scale, without writing every message by hand.

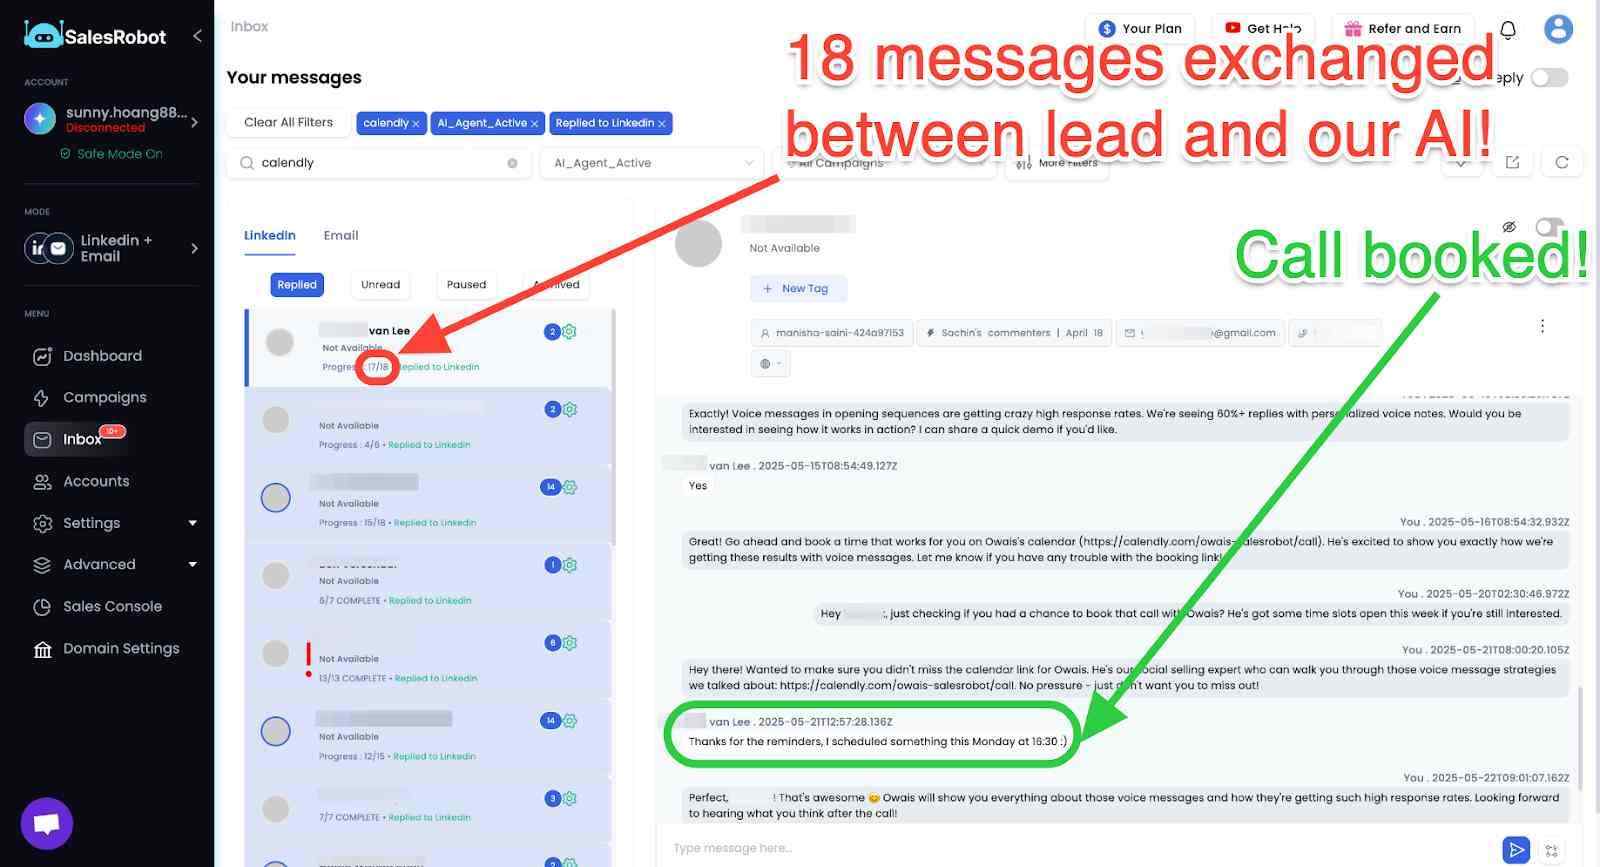
AI Appointment Setter: After a prospect replies, SalesRobot's AI takes over the conversation, handles qualification questions, and books meetings automatically.
You can train it on your specific criteria and ideal responses, which means the early-stage pipeline management largely runs without manual involvement.
For smaller teams without a dedicated SDR, this is a meaningful capability.
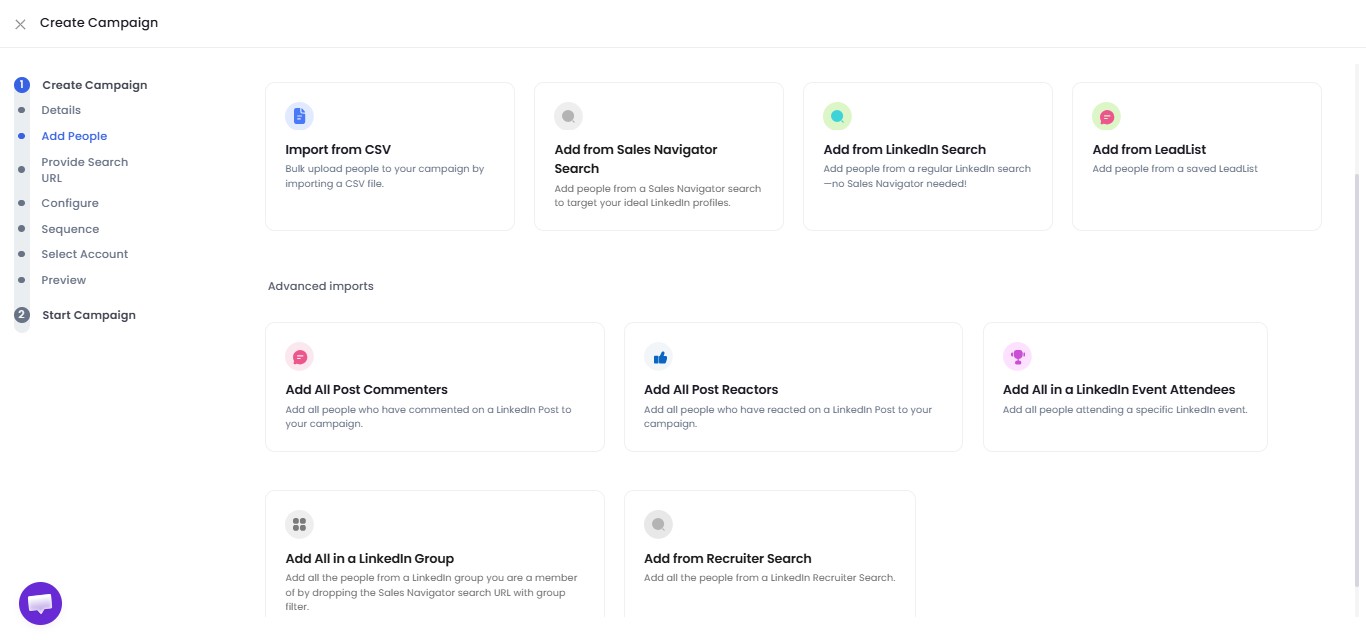
Targeting from inside LinkedIn. SalesRobot imports leads directly from LinkedIn Search, Sales Navigator, LinkedIn Groups, and LinkedIn Events, no CSV wrangling. Tighter targeting is lever #1, and this is how you build a precise list fast.
The proof is in the numbers: SalesRobot users average a 51% connection acceptance rate and a 55% average reply rate, with one customer hitting a 66% reply rate.
It's trusted by 5,000+ B2B sales teams and rated 4.8 on G2 from 57+ reviews.
Pricing is straightforward: Starter $59/month, Advanced $79/month, and Professional $99/month, with annual billing saving 35%.

There's a 14-day free trial, no credit card required.
A 51% acceptance rate sits well above the "high performance" 40%+ band — comfortably out of the danger zone, in any vertical.
Frequently Asked Questions
What is a good LinkedIn connection acceptance rate in 2026?
A good 2026 acceptance rate falls between 30% and 45%. The platform-wide average is 28.5% across 13.2 million requests (Expandi), so 30%+ means you're outperforming.
Anything below 20% is a red flag that triggers account throttling. Always benchmark against your specific industry, not the platform average.
Which industries accept LinkedIn connection requests at the highest rates?
Broadcast Media (40.1%) and Staffing & Recruiting (36.5%) lead among sender industries, while Recruitment and HR recipients accept at 40%+ across verticals.
At the low end, Consumer Electronics (17.5%) and Finance & Banking (25%) sit well below average, and C-suite prospects accept at just 18–25% regardless of industry.
How many LinkedIn connection requests can I send per week in 2026?
Standard accounts can safely send 80–100 requests per week. High-trust accounts, those with an SSI score of 65+ and acceptance rates above 40%, can reach up to 200 per week.
Restricted accounts can drop to as low as 50. The limit is dynamic, adjusting to your acceptance rate and sending patterns.
Does personalizing LinkedIn connection requests improve acceptance rates?
Yes, significantly. Personalized requests achieve roughly 45% acceptance versus ~15% for generic outreach — a 3x improvement.
Personalization works best when it references something specific from the prospect's profile, like a recent job change or shared connection, rather than a generic template that reads as automated spam.
Should you include a note with LinkedIn connection requests?
Include a note when you can personalize it. A note barely changes acceptance (26.42% with vs 26.37% without), but it more than doubles your reply rate post-connection. 9.36% versus 5.44% (Belkins).
Skip the note or send a blank request if your note would be generic, since generic notes can read as spam.
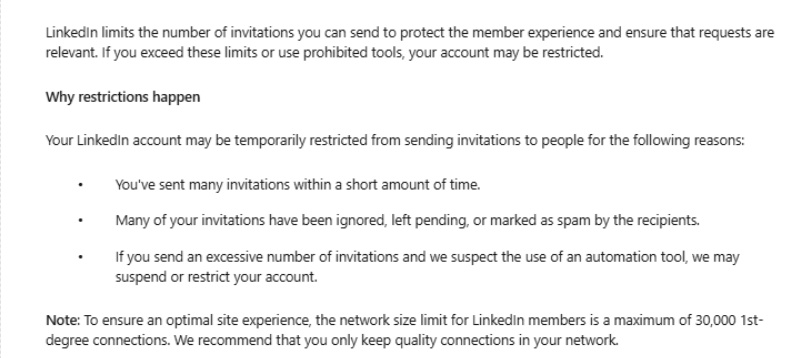
What causes LinkedIn to restrict my outreach account?
Four main triggers: an acceptance rate sustained below 20%, weekly request volume exceeding your account's capacity, action bursts that look non-human (like 40 requests in 10 minutes), and a pattern of generic, non-personalized messaging.
Fixing any one of these can restore your sending capacity within 7–14 days.
Putting It Together: What to Do With Your Number
The platform's average of 28.5% is a distraction. Your real benchmark is your industry's number — and the only question that matters is whether you're above or below it.
Here's the decision map:
- Above 35% in your vertical → you're in good shape. Focus on scaling volume safely and sharpening your post-connection message sequence.
- Between 20–30% in your vertical → targeting or personalization is your bottleneck. Tighten your ICP and add real personalization before you scale.
- Below 20% in any vertical → stop scaling immediately. Sub-20% triggers throttling, which compounds the problem. Fix targeting first, then sending behavior.
That's the case for tooling that handles both halves.
SalesRobot combines safe LinkedIn automation (mobile API, Safe Mode, zero reported bans) with AI Variables personalization that drives a 51% acceptance rate and 55% average reply rate, both comfortably inside the high-performance band this data defines.
Plans start at $59/month with a 14-day free trial and no credit card required. Start your free trial here and stop benchmarking against the wrong number.

Wow your leads by cloning yourself and sending personalized videos and voice notes to each lead on LinkedIn.
If you don't reply to leads within 5 mins, your chances of converting them fall by 50%. Our AI replies on your behalf instantly! (and yes, you can train it)

Don't shoot in the dark. Get detailed analytics on what's working
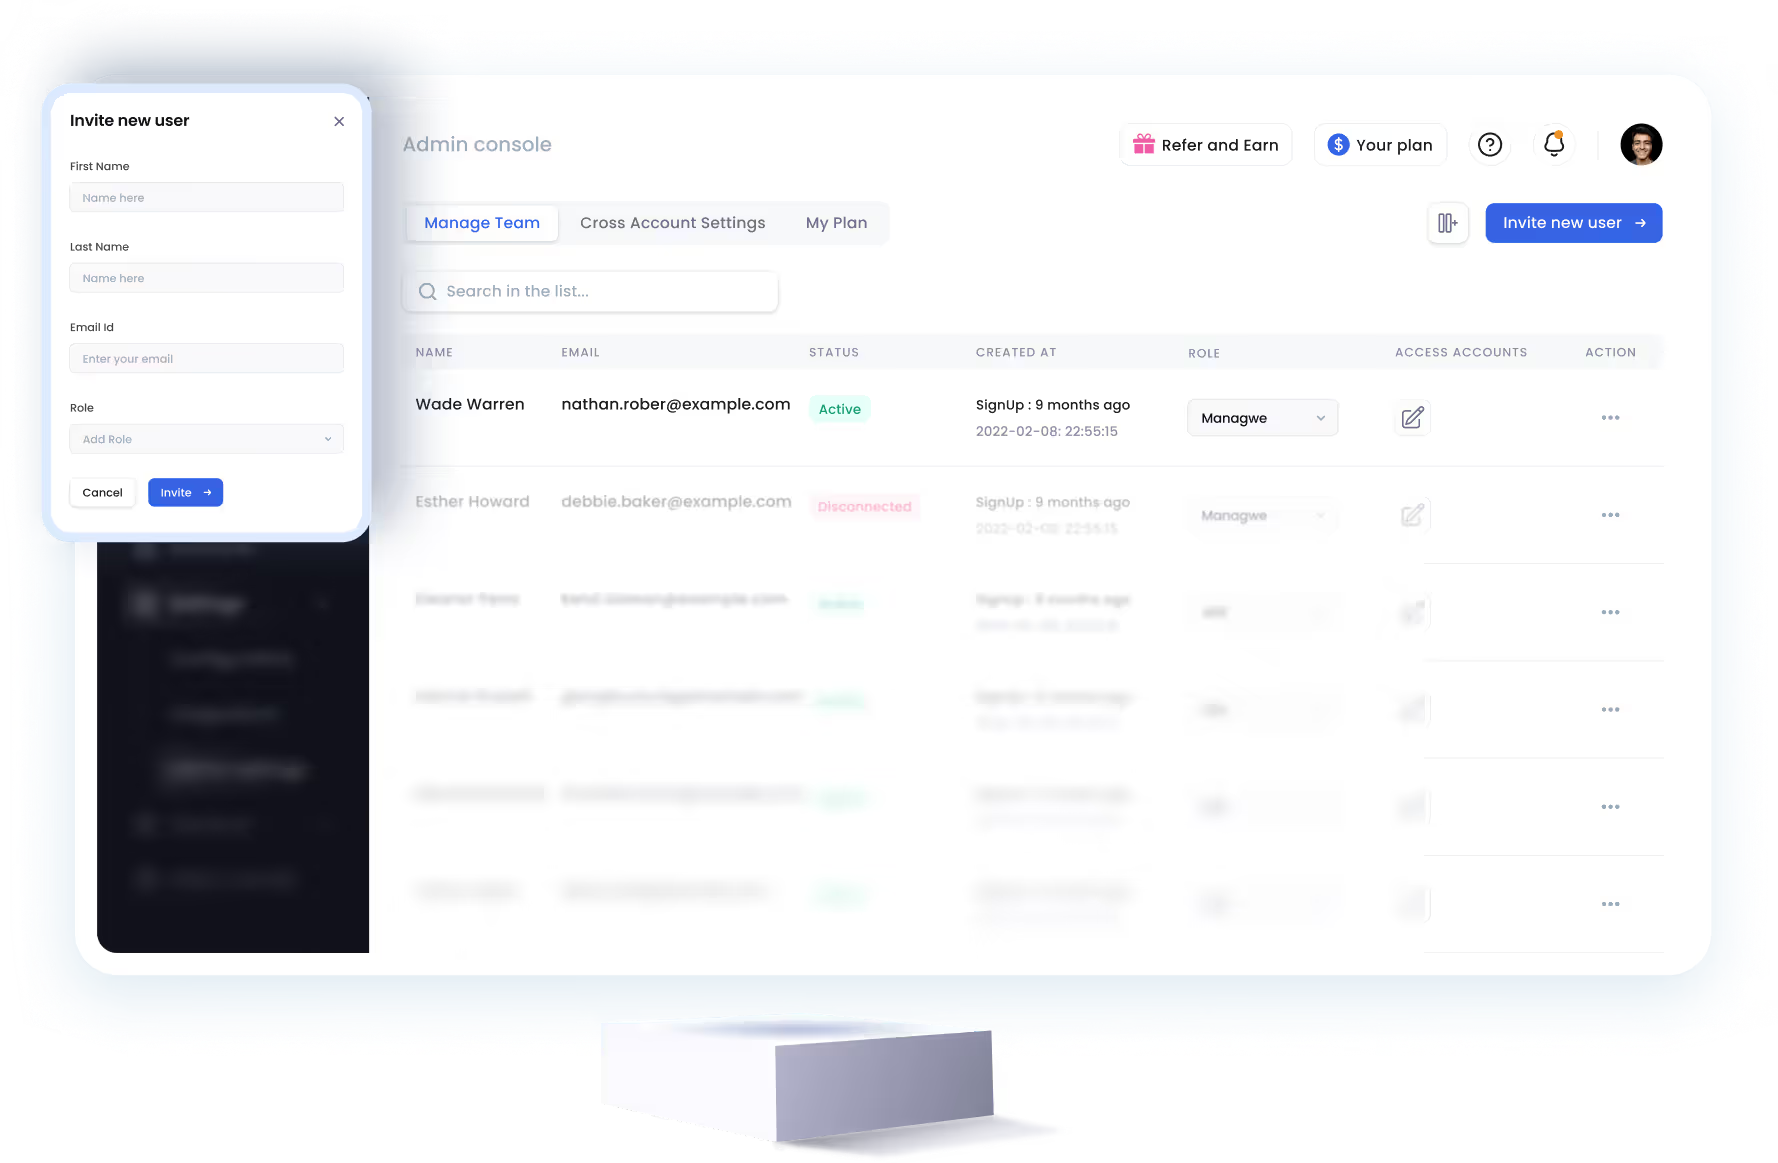
SalesRobot allows you to invite other team members, so that they can add their LinkedIn Account, run outreach campaigns and get amazing results just like you.
Trusted by 4100+ innovative B2B sales teams and lead gen agencies
.avif)
.avif)

.avif)