.avif)
TL;DR
- Seven metrics actually matter: connection acceptance rate, connection-note reply rate, post-connection reply rate, positive reply rate, meetings booked rate, account health score, and pipeline revenue per 1,000 sends.
- A healthy campaign hits 30-45% connection acceptance, 10-16% post-connection reply rate, and 2-5% meetings booked per 1,000 prospects messaged. Anything below 0.5% meetings-booked is rarely a LinkedIn problem.
- Personalization is the biggest lever on the first step: targeted, specific requests reach roughly 45% acceptance versus about 15% for generic ones, per aggregated 2026 benchmarks.
- LinkedIn's 2026 limit is around 100 invitations per week, and a sustained acceptance rate below 30% is widely reported to trigger algorithmic throttling, making acceptance rate both a KPI and a safety valve.
- The metric most people track, messages sent, is the one that matters least. A huge send count with a sub-1% meetings-booked rate is not a volume problem.
- Read any single metric in isolation and you'll misdiagnose your campaign; the funnel only makes sense top to bottom.
👉 Tired of guessing which number is broken? SalesRobot automates safe outreach inside LinkedIn's 2026 limits, personalizes every message with AI Variables, and syncs every reply to your CRM so the metrics track themselves. Try free for 14 days.
Your LinkedIn Campaign Is Running. But Are the Numbers Actually Good?
You open your dashboard. There are numbers everywhere.
Requests sent. Acceptances. Replies. Profile views. Some score LinkedIn invented called SSI.
And you have no idea which of these means your campaign is working, or which one you should panic about.
Here's the trap: vanity metrics are easy to grow, and revenue metrics are hard.
It's trivial to 10x your impressions with a spicy hook. It's meaningless if none of those people are buyers.
Most metric guides make this worse by listing 20 numbers and calling it a day. This post does the opposite.
We're cutting to the 7 metrics that actually diagnose your campaign, and giving you the verified 2026 benchmark for each, so you know what "good" looks like.
One rule before we start: these metrics form a funnel, and a weakness at any stage collapses everything below it.
A high acceptance rate with a dead reply rate is a messaging problem, not a targeting problem. A strong reply rate with no meetings is an offer or follow-up problem. Each number points at a different broken layer. That's the whole game.
The Master Benchmark Table: LinkedIn Automation Metrics at a Glance (2026)
Here's every metric we're about to break down, with the honest ranges. Screenshot this.
One honesty note before you take any single number as gospel: published acceptance-rate averages range from 26% to 51%, because every public study comes from a vendor measuring its own users.
There's no single "true" number. Use these as ranges, not laws. For context, SalesRobot's own customer data lands at the top of these ranges: 51% connection acceptance and 55% average reply rate.

SalesRobot is a cloud-based LinkedIn and email outreach tool that automates connection requests, follow-ups, and replies. We'll reference it throughout, since it's built around hitting the benchmarks below.
Metric 1: Connection Acceptance Rate, The Gatekeeper KPI
Track this first, because nothing else can happen until people accept.
Connection acceptance rate is the percentage of your sent requests that get accepted. Calculate it as accepted divided by sent.
As of 2026, the platform-wide average sits around 28.5% (Expandi's dataset of 13.2M connection requests), while Cleverly places the healthy range at 30-45%. That puts 30-45% squarely in the healthy zone.
Here's what most guides miss: acceptance rate isn't just a KPI, it's a safety valve.
If your acceptance rate drops below 30%, LinkedIn's algorithm assumes you're spamming and tightens your restrictions, quietly shrinking the number of requests you're allowed to send.
So a bad acceptance rate doesn't just cost you conversations. It costs you your sending ceiling.
Two things move this number: targeting and personalization. Requests that reference something specific about the prospect reach roughly 45% acceptance versus about 15% for generic ones. That's triple the pipeline from the same list.
One honest caveat worth knowing: the biggest driver of that lift is targeting active, relevant prospects and writing a specific human opener, not AI wording on its own.
Expandi's own 2026 data actually found AI-hyperpersonalized templates performed slightly worse on acceptance than the accounts' own human-written ones. So "personalization" means relevance and specificity, not just switching on an AI toggle.
Worth flagging: acceptance varies wildly by industry. Staffing and Recruiting runs around 36.5% while Apparel and Fashion sits near 19.9%. Benchmark against your segment, not the platform average.
This is where SalesRobot's approach earns its keep. It uses mobile API technology that mimics human behavior, randomized delays, human-like daily limits, residential IP rotation, so it stays under the radar that trips up desktop tools.

Its AI Variables personalize each request using real LinkedIn profile data like recent job changes and shared connections, giving you the specificity that pushes acceptance toward that 45% ceiling. SalesRobot customers average a 51% connection acceptance rate.

Metric 2: Connection-Note Reply Rate, The Forgotten Early Signal
Almost nobody tracks this, and it's the earliest read on whether your copy works.
When you send a connection request with a note, you can track two different things: whether the request was accepted, and whether the note itself got a reply.
Most people only watch the first. The second is a distinct, earlier signal, it tells you if your opening line is compelling before the relationship even forms.
Platform-wide, connection-note reply rate has slipped from around 3.0% to 2.2% over the past year (Expandi), as inboxes get louder. So benchmark it low, and treat any decline as saturation, not necessarily your copy failing.
Here's the counterintuitive part. The note barely moves acceptance. Belkins found 26.42% acceptance with a message versus 26.37% without. Basically identical.
But the note massively moves conversation. Per Belkins' 20M-attempt study, adding a brief note lifts the post-accept reply rate by around 72% (from 5.44% to 9.36%).
So the note isn't there to get you accepted. It's there to start the actual conversation.
A weak connection-note reply rate means your first words aren't landing. Fix that before you blame your targeting.
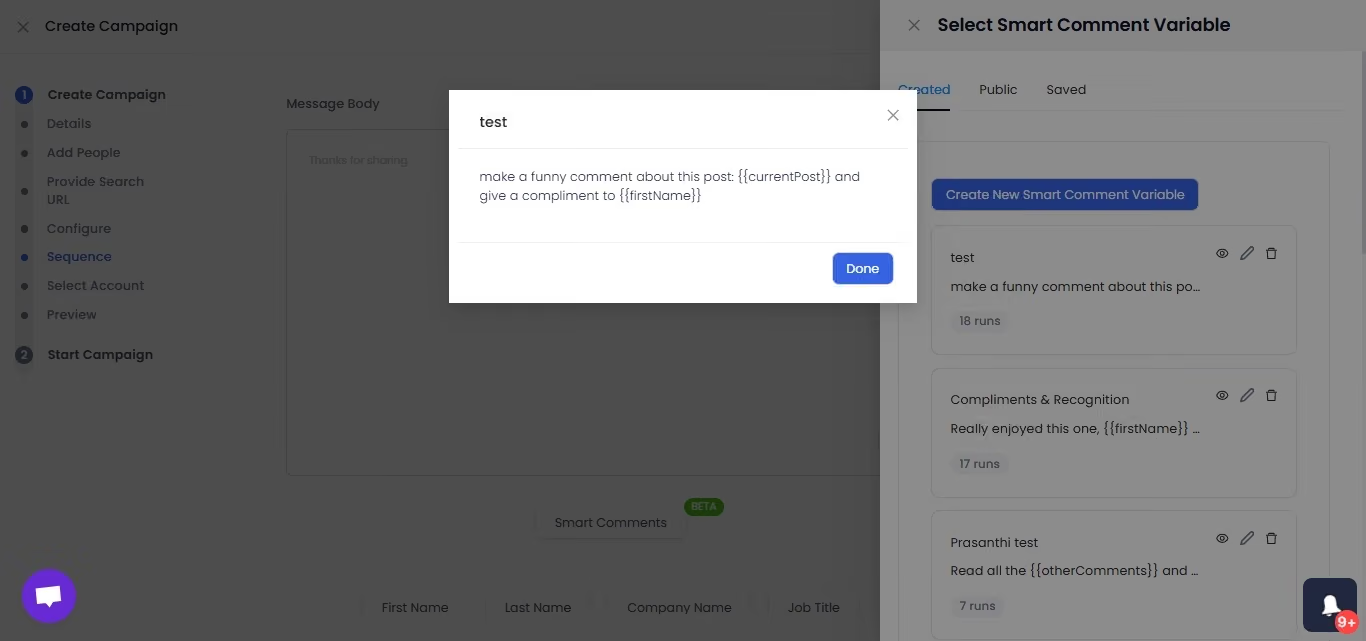
To warm this number up, SalesRobot has a feature called Smart Comments: it automatically writes and posts AI-generated comments on a prospect's LinkedIn posts before you reach out, so your name isn't a stranger when your note arrives.
Metric 3: Post-Connection Reply Rate, The Real Engagement Test
This is the "reply rate" everyone means but rarely defines.
Once someone accepts, what percentage replies to your first real message? That's your post-connection reply rate, and it's the single best read on whether your messaging resonates with the people you're actually connected to.
The 2026 benchmark is 10.4% platform-wide (Expandi), climbing to 16.86% for messenger campaigns to first-degree connections.
For context, that beats cold email handily: LinkedIn DMs average a 10.3% reply rate versus 5.1% for cold email.
If your acceptance rate is healthy but your reply rate is in the gutter, the problem is your message, not your list. Don't touch your targeting until this number is fixed.
Two SalesRobot features live here. AI Variables pull relevant details from each prospect's profile to craft the message.
And the AI Appointment Setter works in Copilot mode (it suggests personalized replies you approve with one click) or Autopilot mode (it manages the whole conversation and handles objections 24/7).

SalesRobot customers average a 55% reply rate, and The Growth Agency hit 66%, proof of what an optimized version of this metric looks like.
Metric 4: Positive Reply Rate, Because "Not Interested" Doesn't Count
A high reply rate is a vanity metric if half of those replies are "please remove me."
Positive reply rate measures interest signals as a percentage of your total replies. It's the number that separates a genuinely healthy campaign from a busy-looking one.
A good benchmark: 20 to 40% of your total replies should be interest signals.
This is the metric that catches self-deception. You brag about a 15% reply rate. Then you read the replies and two-thirds are "no thanks." Your real signal rate is closer to 5%.
Messages sent and connections made are meaningless if they don't convert, and a reply that says "not interested" is a non-conversion wearing a costume.
Track this by tagging your replies: positive, neutral, negative. If your positive share is under 20%, your targeting or your offer is off, even when the raw reply rate looks fine.
SalesRobot's AI Appointment Setter in Autopilot mode helps here by qualifying leads and handling objections automatically, so neutral and negative replies don't eat your reps' time, and your positive replies get routed straight toward a booked meeting.
Metric 5: Meetings Booked Rate, The One Number That Pays the Bills
This is the first metric that sits close enough to revenue to matter to your boss.
Meetings booked rate is the percentage of prospects you messaged who ended up on your calendar. The benchmark: 2 to 5% is solid, 5%+ is excellent.
A working reference range is 1-3% of total sends converting to a booked meeting. If you're consistently below 0.5%, that's rarely a LinkedIn problem. It's an offer, ICP, or follow-up problem.
The math compounds fast. At 20 connections per day per sender, with 25% acceptance and a 2% meetings-booked rate, one sender produces roughly 10-12 meetings per month.
Run five senders and you're looking at 50-60 monthly meetings from the same playbook.
Here's the catch most people hit: you can't accurately attribute meetings back to a LinkedIn campaign without your CRM in the loop.
SalesRobot integrates natively with HubSpot, Salesforce, and Pipedrive. When a prospect accepts or replies, their data auto-syncs, including conversation history and campaign activity.
On top of that, the AI Appointment Setter books qualified meetings directly into your calendar. No manual logging, no guessing which channel produced the meeting.
Metric 6: Account Health Score, The Metric That Protects All the Others
Ignore this one and every other metric on this list eventually goes to zero.
Account health isn't a single number, it's a composite. It's your daily send rate versus LinkedIn's limits, your pending-request pile, your withdrawal habits, and whether you've picked up any platform warning flags.
Blow this and you don't lose a campaign; you lose the account.
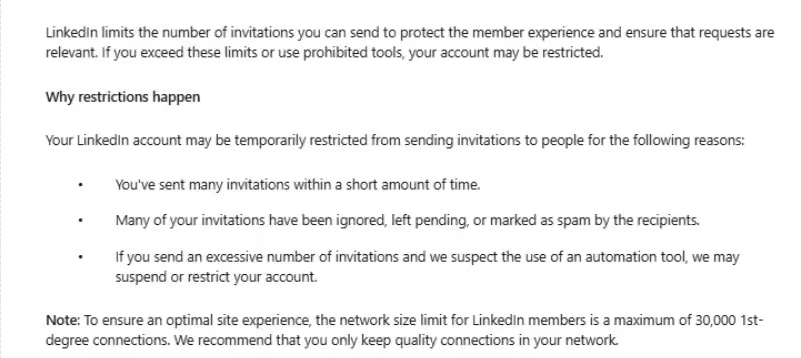
Here are the numbers that matter, as of 2026. LinkedIn's connection limit is widely reported at around 100 invitations per week across all tiers, on a rolling 7-day window.
The daily soft cap is around 20-25 requests before throttling kicks in. And you should keep your pending list under 1,000 by withdrawing unaccepted requests regularly.
Beyond limits, watch the deliverability signals: spam reports, unsubscribes, and account warnings. These are the early smoke before the fire.
This is the metric SalesRobot is built around. It uses mobile API technology that mimics human behavior, randomized delays and human-like daily limits, and runs cloud-based, so it works 24/7 without keeping your browser open.
Customers report zero account bans when following SalesRobot's Safe Mode guidelines. The whole point is to keep this metric green so the other six can even exist.
Metric 7: Pipeline Revenue Per 1,000 Sends, The Metric That Ends All Arguments
Every other number on this list is a means to this one.
Revenue per 1,000 prospects messaged is the ultimate benchmark, the number that actually matters for your business.
It rolls acceptance, reply, positive reply, and meetings booked into a single figure that answers the only real question: is LinkedIn automation making us money or just making us busy?
Here's why almost nobody calculates it: it requires your CRM connected to your outreach, so you can trace a message all the way to a closed deal. Most campaigns feel like guesswork precisely because this loop is never closed.
To make it concrete: track how many deals (and how much pipeline) came from every 1,000 prospects a campaign touched.
When that number rises campaign over campaign, you're improving. When it flatlines while your send count climbs, you're just adding noise.
SalesRobot's API and webhooks support 20+ events for custom workflows, and its native CRM sync pushes conversation history and campaign activity into HubSpot, Salesforce, or Pipedrive automatically. That's the plumbing that makes Metric 7 calculable instead of theoretical.
The 3 Metrics Most People Track That Tell You Almost Nothing
Not every number deserves your attention. These are the ones reps and agencies love to put in reports, but track them as diagnostics at most, never as a scoreboard.
- Messages sent. The most common "metric" and the least useful. Messages sent and connections made are meaningless if they don't convert. A record send count with a 0.5% meetings rate isn't a win.
- Profile views. Nice ego boost. It's trivial to 10x impressions with a provocative hook, and meaningless if none of them are buyers.
- LinkedIn SSI score. A content-and-networking index that has almost nothing to do with outbound conversion. It's the metric the content-marketing guides love, and the one outbound operators can safely ignore.
How SalesRobot Moves These Numbers (Without Blowing Up Your Account)
We're obviously not neutral here, but the math is worth running, because SalesRobot touches four of the seven metrics above directly.
The contrast that matters: most tools that move these numbers do it by pushing volume through a browser extension on a fixed IP, the exact setup that tanks Metric 6 (account health) and eventually zeroes out the rest.
SalesRobot moves the numbers the other way, by protecting the account first. Here's how it maps to the funnel:
SalesRobot customers average a 51% acceptance rate and 55% reply rate; The Growth Agency hit 66%.
Pricing starts at $59/month (Advanced $79, Professional $99, annual billing saves up to 35%), trusted by 4,100+ B2B sales teams with a 4.8 rating on G2. There's a 14-day free trial, no credit card required, enough to watch these numbers move on your own list.
Frequently Asked Questions
What is a good reply rate for LinkedIn outreach?
A good post-connection reply rate in 2026 is roughly 7-10% on messages after a connection is accepted, with 10% being solidly healthy.
LinkedIn DMs average 10.4% platform-wide, and messenger campaigns to first-degree connections reach 16.86%, both well above cold email's 5.1% average.
What is a good LinkedIn connection acceptance rate in 2026?
A good acceptance rate lands between 30% and 45%. The platform-wide average is about 28.5% (Expandi's 13.2M-request dataset), and Cleverly places the healthy range at 30-45%.
Personalized, well-targeted requests reach roughly 45% versus about 15% for generic ones. Note segment variation, Staffing runs near 36.5% while Fashion sits near 19.9%.
What metrics matter for LinkedIn automation campaigns?
Seven metrics matter: connection acceptance rate, connection-note reply rate, post-connection reply rate, positive reply rate, meetings booked rate, account health score, and revenue per 1,000 sends.
Read them as a funnel, a weak stage collapses everything below it. Ignore vanity numbers like messages sent, profile views, and SSI.
How many LinkedIn connection requests can you send per week in 2026?
The widely reported figure is around 100 connection invitations per week across all tiers, on a rolling 7-day window. LinkedIn doesn't publish this number officially, but it's consistent across automation tools and trackers.
The daily soft limit is around 20-25 requests before throttling begins. Keep your pending list under 1,000 by withdrawing unaccepted requests to protect your account health.
Does personalizing with AI increase acceptance rates?
It depends on what you mean by personalization. Requests that reference something genuinely specific and relevant about the prospect reach roughly 45% acceptance versus about 15% for generic ones, a 3x lift.
But the lever is relevance and specificity, not an AI toggle by itself. One large 2026 dataset (Expandi) actually found generic AI-hyperpersonalized templates performed slightly worse on acceptance than human-written ones.
Used well, AI that pulls real profile details to write a specific opener helps; used lazily, it doesn't.
Does LinkedIn have a limit on connection requests?
Yes. LinkedIn is widely reported to enforce a roughly 100-invitation weekly limit in 2026, with a daily soft cap near 20-25 before throttling.
Critically, if your acceptance rate drops below 30%, the algorithm assumes spam and tightens your restrictions further, so a low acceptance rate can shrink your sending ceiling on top of the base limits.
Which metric should I try to fix first?
Start at the top of the funnel and fix the first stage below benchmark, because everything downstream inherits that weakness.
Acceptance below 30% means fix targeting and personalization first (or LinkedIn throttles you anyway). Acceptance fine but reply rate dead means it's your message. Great reply rate but no meetings means it's your offer or follow-up. Never diagnose from a single number in isolation.
Putting It Together: Which Metric Do You Fix First?
Here's the core takeaway: these seven metrics aren't a checklist, they're a diagnostic chain.
Start at the top and fix the first stage that's below benchmark, because everything downstream is inheriting that weakness.
Acceptance below 30%? Fix targeting and personalization before anything else, or LinkedIn throttles you anyway. Acceptance fine but reply rate dead? It's your message. Great reply rate but no meetings? It's your offer or your follow-up.
The honest reality check: no tool hands you a 5% meetings-booked rate on day one. These benchmarks are earned by tuning each stage of the funnel, and the "good" numbers assume you're personalizing and staying inside LinkedIn's limits.
That's where SalesRobot fits. It keeps your account healthy with mobile-API safe sending, personalizes every touch with AI Variables, and syncs every reply to your CRM so Metrics 5 and 7 stop being guesswork. Customers average 51% acceptance and 55% reply rates for a reason.
https://www.youtube.com/watch?v=7cnln_eHbRM
Start at $59/month with a 14-day free trial, no credit card required, and watch which number moves first: try SalesRobot free.

Wow your leads by cloning yourself and sending personalized videos and voice notes to each lead on LinkedIn.
If you don't reply to leads within 5 mins, your chances of converting them fall by 50%. Our AI replies on your behalf instantly! (and yes, you can train it)

Don't shoot in the dark. Get detailed analytics on what's working
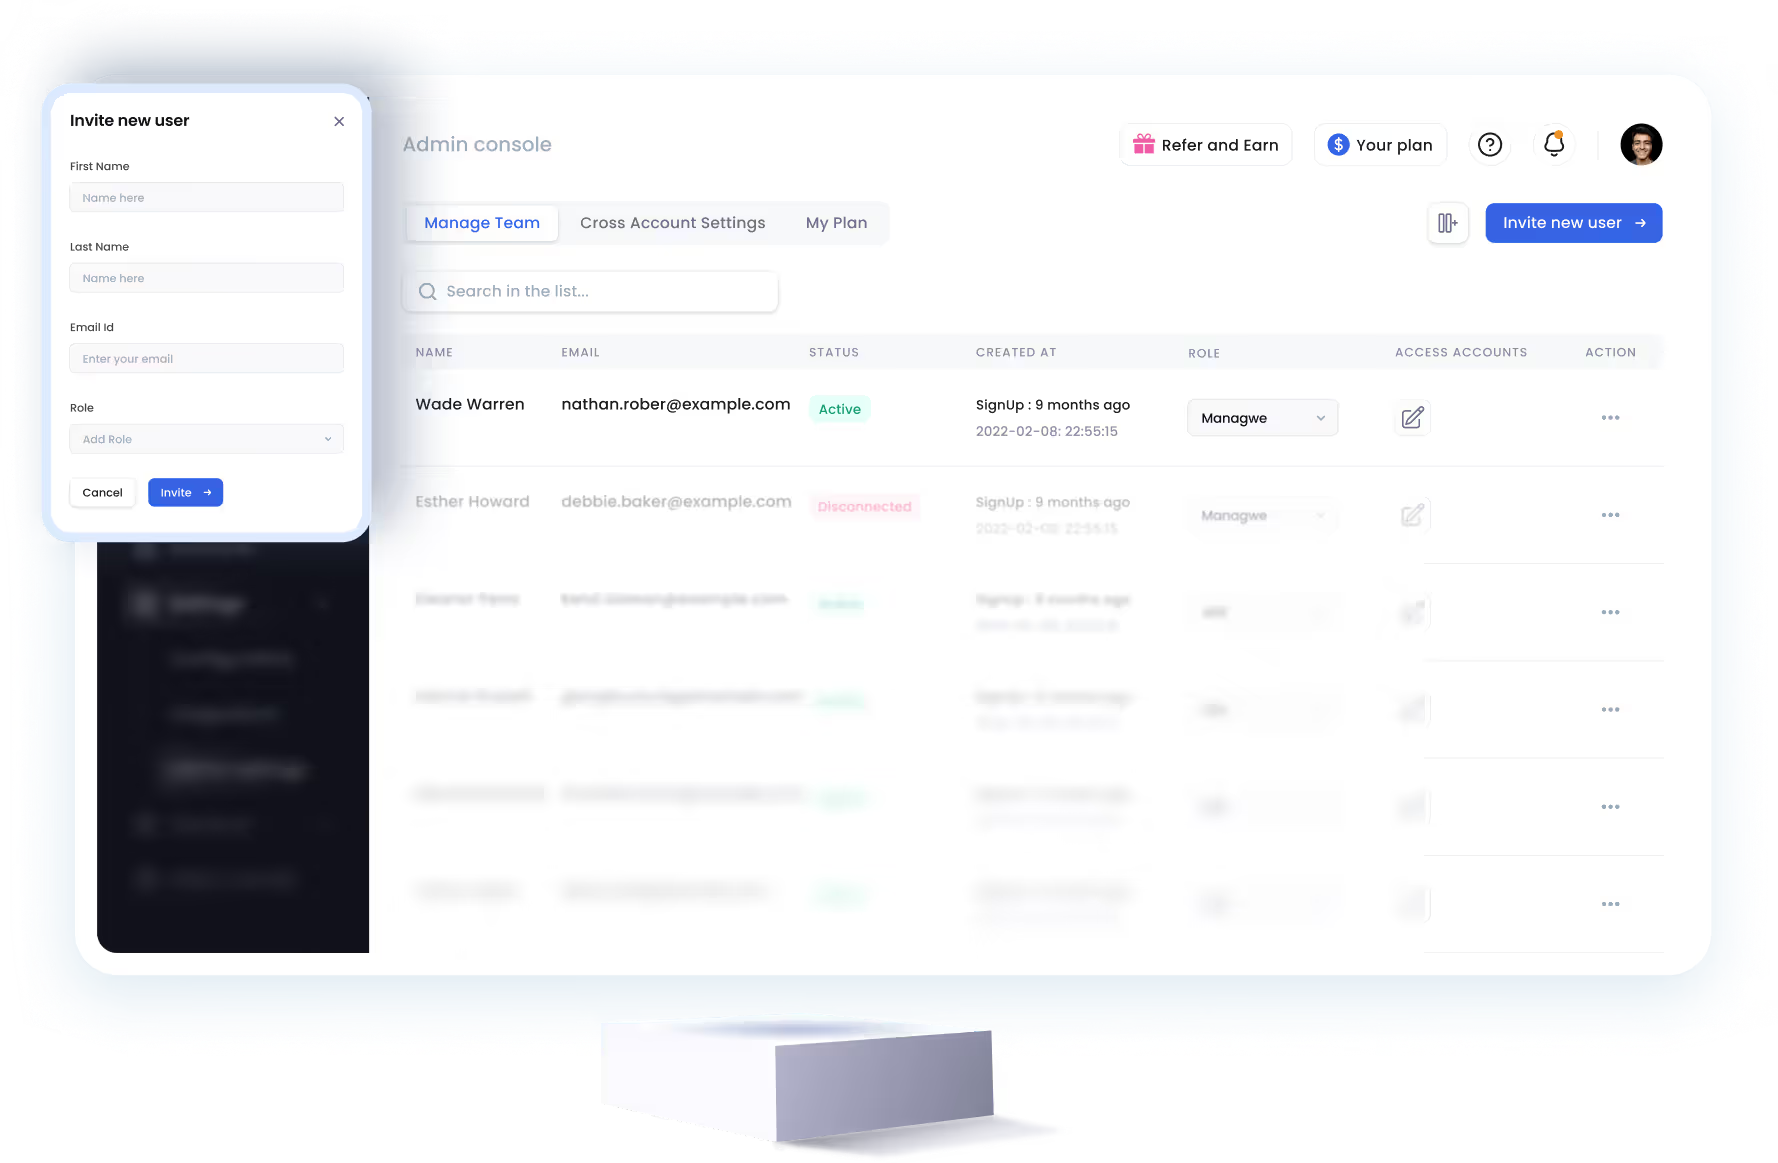
SalesRobot allows you to invite other team members, so that they can add their LinkedIn Account, run outreach campaigns and get amazing results just like you.
.avif)


Trusted by 4100+ innovative B2B sales teams and lead gen agencies

.avif)

.avif)



.avif)

Heading 1
Heading 2
Heading 3
Heading 4
Heading 5
Heading 6
Lorem ipsum dolor sit amet, consectetur adipiscing elit, sed do eiusmod tempor incididunt ut labore et dolore magna aliqua. Ut enim ad minim veniam, quis nostrud exercitation ullamco laboris nisi ut aliquip ex ea commodo consequat. Duis aute irure dolor in reprehenderit in voluptate velit esse cillum dolore eu fugiat nulla pariatur.
Block quote
Ordered list
- Item 1
- Item 2
- Item 3
Unordered list
- Item A
- Item B
- Item C
Bold text
Emphasis

Superscript
Subscript